|
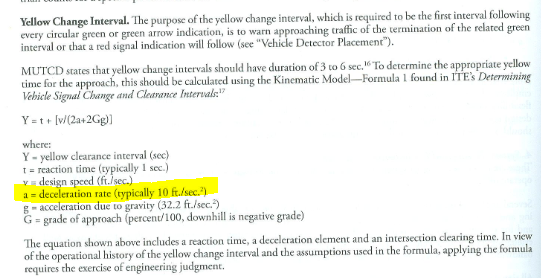
Yellow Duration for a Traffic Signal
Contrast between Practice and What is Required
|
Driver or Vehicle Characteristic
|
Institute of Transportation
Engineers Yellow Light Specification
Practice
|
Passenger Car
What is Required
|
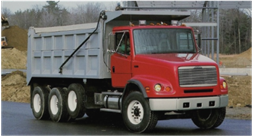
Commercial Vehicles
What is Required
|
|
|

|
|
|
|
Perception
Reaction Time
|
|
|
1.0 to 5.0
Seconds
|
|
|
|
AASHTO
Green Book 2011, page 2-41.
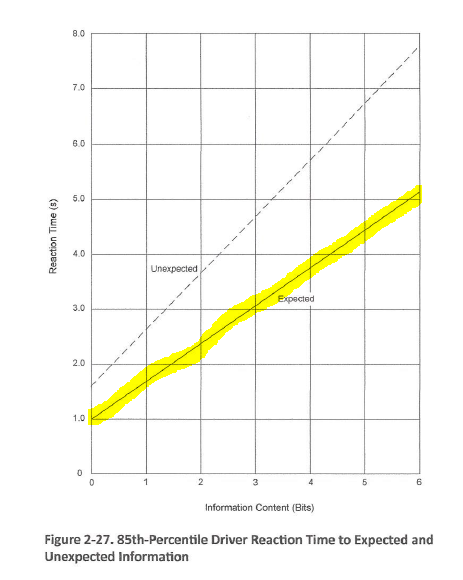
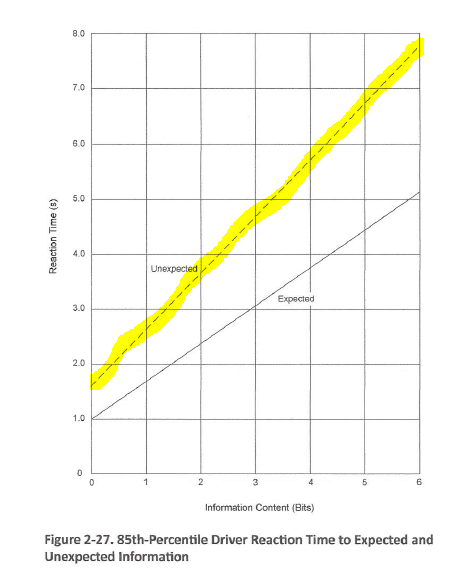
The more information content the driver has to deal with near or
at the intersection, the more reaction time the driver needs to deal with
it.
|
|
|
|
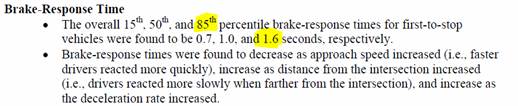
The 85th percentile perception-reaction
time is 1.57 seconds. Setting the
perception reaction time to even 1.57 seconds excludes a large predictable
set of drivers. Many sources simply
recommend a 2.5 second minimum.
Gates, Dilemma Zone Driver Behavior as a Function of
Vehicle Type, Time of Day and Platooning, Transportation Research Record: Journal of
the Transportation Research Board, No. 2149, Transportation Research
Board of the National Academies, Washington, D.C., 2010, .p.
87.
|
|
|
|
Transportation
Research Institute, Oregon State Univ, 2007, p 8
|
|
|
|
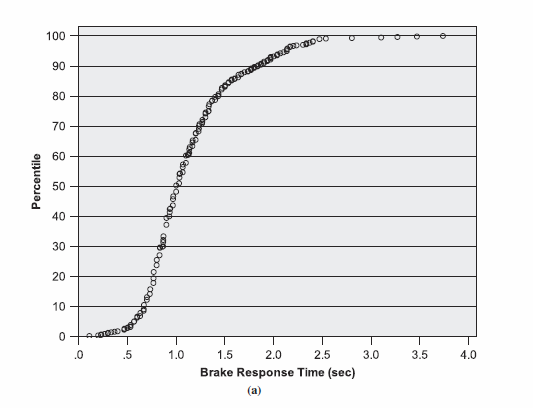
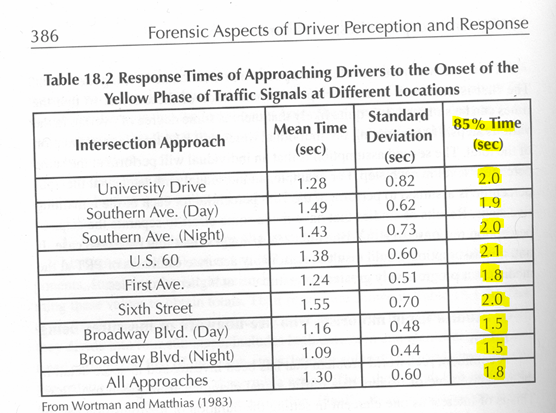
Olson,
Forensic Aspects of Driver Perception and Response, 2010, p. 386. The standard deviations are half the
range of values. That means there
are as many people responding in 0.6 seconds as 1.0 seconds as 1.4
seconds.
|
|
|
|
Transportation
Research Board, Wisconsin, 2007, page 21
|
|
|
2.2 Seconds Minimum
|
|
|
|
Gates,
Dilemma Zone Driver Behavior as a Function of Vehicle Type, Time of Day
and Platooning, Transportation
Research Record: Journal of the Transportation Research Board, No. 2149, Transportation Research
Board of the National Academies, Washington, D.C., 2010, p. 88.
|
|
|
Air Brake
Lag Time
|
|
|
|
|
Deceleration
|
|
|
|
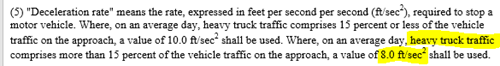
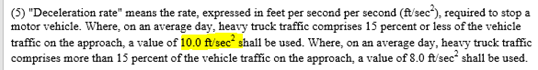
8.0 ft/s2 Maximum
Shorts a Yellow by 1
Second at 45 mph
|
|
|
|
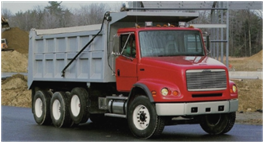
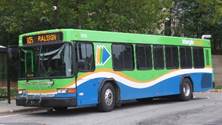
Comparison between passenger cars and
commercial trucks.
Gates,
Dilemma Zone Driver Behavior as a Function of Vehicle Type, Time of Day
and Platooning, Transportation
Research Record: Journal of the Transportation Research Board, No. 2149, Transportation Research
Board of the National Academies, Washington, D.C., 2010, p.
91.
|
|
|
|
Gates,
Dilemma Zone Driver Behavior as a Function of Vehicle Type, Time of Day
and Platooning, Transportation
Research Record: Journal of the Transportation Research Board, No. 2149, Transportation Research
Board of the National Academies, Washington, D.C., 2010, pp. 84–93.p.
84
|
|
|
|
Maryland
Title 11 DOT, Subtitle 4, Ch 14.
Traffic Signal Control Monitoring
|
|
|
|
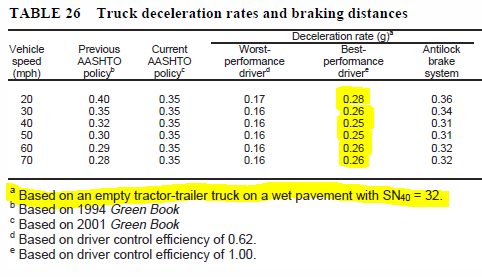
NCHRP
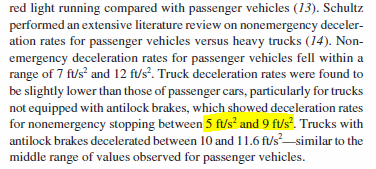
505, p. 48 0.25g = 0.25 * 32.2 ft/s2 = 8.0
ft/s2 These are maximum deceleration rates a truck
driver can do on a wet pavement in any situation. The comfortable rates will be less
than these.
|
|
|
|
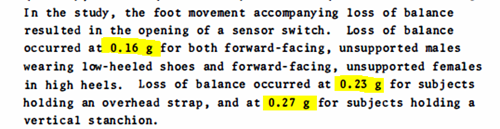
USDOT, Effects of Deceleration on Live Human
Subjects, 1977, p 1, 0.23g =
0.23 * 32.2 ft/s2 = 7.4 ft/s2 The deceleration rate of transit
commercial vehicles, like school and public buses, are capped by the
position of their human occupants.
|
|
|
|
North
Carolina School Bus Drivers Handbook, 2014, p. 15
|
|
|
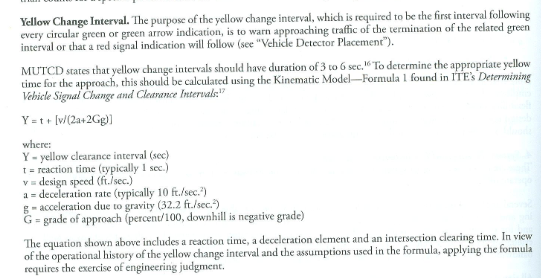
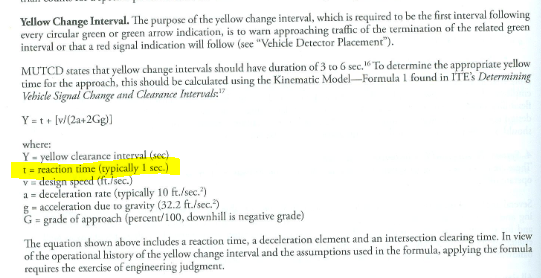
Approach
Speed
|
|
Speed Limit
Maximum
|
|
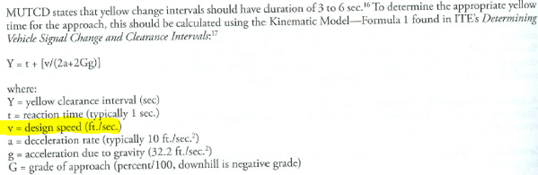
|
|
ITE,
Traffic Engineering Handbook, 2010, p. 412.
The ITE Handbook leaves the definition of “v”
ambiguous. The design speed is
not necessarily the speed limit.
The design speed is not necessarily the operational speed. The
operational speed is the actual measured speed of the traffic and is the
value engineers are supposed to use.
|
|
|
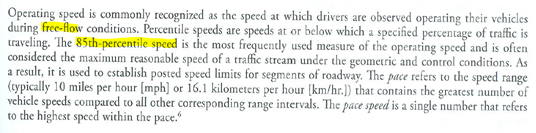
85th
Percentile, Speed Limit Minimum
|
|
|
|
ITE,
Traffic Engineering Handbook, 2010, p. 101.
The speeds engineers place on speed limit signs and
input into the yellow light formula is a topic unto itself. The incompatibility between
properly-engineered speeds and man-made laws is always present.
A basic rule of engineering is to accommodate human
behavior. When the majority of
traffic travels above the speed limit, the engineer should accommodate
the majority. An engineer should
set the yellow light using that higher speed, thus lengthening the yellow
thus making the intersection safer.
The engineer cannot set “v” below the speed limit for that would
effectively remove the required stopping distance from the legally-moving
driver, force him to break the law and possibly force him to crash.
Speed limits themselves are supposed to be set to the
85th percentile speed but physical limitations and city
ordinances control what numbers appear on the speed limit sign. For example, even though the 85th
percentile speed changes between rush hour and midnight, only one speed
limit value can be appear on a sign.
The sign cannot say “35 mph” from 7 AM to 9 AM then change to “55
mph” from 11 PM to 5 AM. Also
many cities have ordinances which require speed limits confined to
increments of 10 mph; for example, 5, 15, 25, 35, 45 and 55 mph. And so the traffic engineer picks the
lowest closest speed but the speed may be too slow—too unnatural for the
motorist. Imagine a 10 mph sign
on Interstate 40. How dangerous
would such a sign make the Interstate?
|
|
Approach Speed is the Least of Concerns
Many traffic engineers are aware of setting yellows
with the 85th percentile speed. Many anti-red light camera
organizations focus on the 85th percentile speed. In the end, however, traffic engineers
not adopting the 85th percentile speed is the least of the
engineers’ oversights. While a
driver can control his speed, a driver cannot control the laws of
physics, how fast his vehicle can decelerate or how fast his brain can
react to information.
Nonetheless, a properly set 85th
percentile speed will increase the yellow by about 1 second.
|
|
|
85th
Percentile, Speed Limit Minimum
Shorts a Yellow by 1 Second
|
|
|
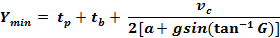
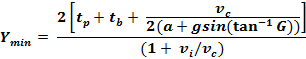
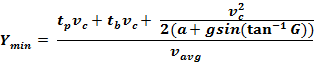
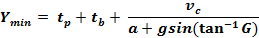
Equation for Duration of Yellow Light
|
|
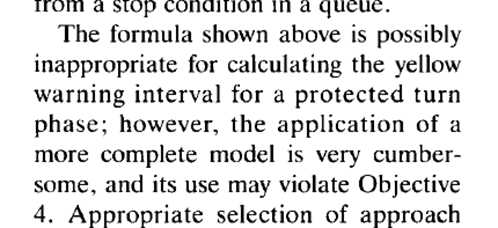
Straight-Through Unimpeded
Movement Equation
(Equation shorts yellow time by several seconds for all movements
other than for straight unimpeded traffic.)
|
|
|
|
ITE,
Traffic Engineering Handbook, 2010, p. 412. The physics of this formula models
only straight-through traffic but DOTs apply it to all traffic
movements.
The formula offers the driver a mutually exclusive
choice between stop and go full speed.
If the driver must proceed because he is too close to the
intersection, the formula does not allow him to slow down for any
reason. The formula does allow to
slow down to turn, to slow down to avoid cars entering or egressing from nearby
business, to slow down to avoid a hazard, or to slow down just to be
cautious.
|
|
|
|
ITE,
Traffic Engineering Handbook, 2010, p. 412. ITE caps the yellow change interval
to 5 seconds but turning movements can take up to 9 seconds. Also ITE ignores the physics of the
equation. ITE makes up new laws
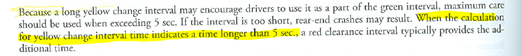
of nature and expects drivers to conform. Also the statement “a long yellow
change interval may encourage drivers to use it as a part of the green
interval” is a rumor. Never once
in a single study of automated signals in a hundred years has this
statement been shown to be true.
The rumor dates back to the manually-controlled
signal lights of the 1920s. Then
a police officer would change the signal manually. If the policeman flipped the signal
to yellow and saw a car coming, he would delay switching the signal to
red. He would anticipate the driver
and hold the yellow longer.
Drivers could anticipate the policeman’s behavior and thus “treat
the yellow like a green.”
|
|
|
|
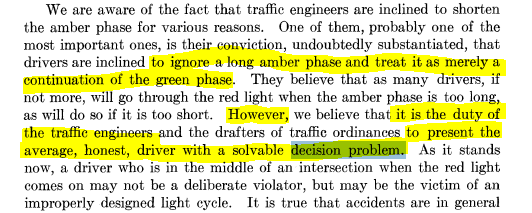
Gazis,
1960 p 131. Gazis points out
that traffic engineers are inclined to shorten the yellow light below his
formula. But Gazis warns that
such shortening creates dilemma zones forcing an honest driver to
unintentionally run a red light.
ITE’s cap at 5 seconds does exactly what the inventor of the
formula says not to do.
Any jurisdiction (like Chicago or Winnipeg) that sets
a yellow shorter than the ITE formula automatically forces honest drivers
to run red lights. Setting the
yellow to MUTCD minimum (3 seconds) where the formula says more, does the
same thing. It forces honest drivers
to run red lights unintentionally.
|
|
|
|
ITE,
Determining Vehicle Change Intervals, 1989, p 29. ITE admits that the formula does not apply
to turning traffic but tells engineers not to worry about it because of
“Objective 4.” Objective 4 is to
keep costs down. The assumption
is that the time it takes to devise the true formulas would cost too much
money. (The true formulas are presented
at the right.)
|
|
|
Equations for Straight, Turning,
Impeded and General Movements
|
|
Formula for Unimpeded Straight-Through Movement
Traffic
(Gazis,
Herman, Maradudin, ITE)
|
|
Formula for Turning Traffic (Left,
Right, U)
(Liu,
et al., American Society of Civil Engineers, Eq 13)
|
|
Formula for Impeded Traffic
|
|
General Formula That Works for all
Traffic
|
|
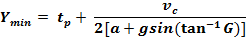
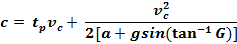
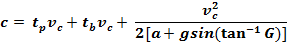
Stopping Distance (or critical distance) Formula. vc is measured at distance c:
|
|
Derivation of Above Formulas from
Newton’s Second Law of Motion.
(G = grade, g =
earth’s gravitational acceleration = 32.2 ft/s2. See derivation).
The general formula and the formula
for turning traffic compute yellow times several seconds longer than practice. For example, the general formula for
a typical 45 mph road computes a yellow change interval about 3 seconds
longer than the straight-through formula.
|
|
|
Equations for Straight, Turning,
Impeded and General Movements
Including Air Brake Lag Time
|
|
Formula for Unimpeded Straight-Through Movement
Traffic
(Gazis,
Herman, Maradudin, ITE)
|
|
Formula for Turning Traffic (Left,
Right, U)
(Liu,
et al., American Society of Civil Engineers, Eq 13)
|
|
Formula for Impeded Traffic
|
|
General Formula That Works For all
Traffic
|
|
Stopping Distance (or critical distance) Formula. vc is measured at distance c:
|
|
Derivation of Above Formulas from
Newton’s Second Law of Motion.
(G = grade, g =
earth’s gravitational acceleration = 32.2 ft/s2, tb
= air brake lag time. See
derivation).
The general formula and the formula
for turning traffic compute yellow times several seconds longer than practice. For example, the general formula for
a typical 45 mph road computes a yellow change interval about 5 seconds
longer than the straight-through formula.
|
|
|
POLICE LINE
|
POLICE
LINE POLICE LINE POLICE LINE POLICE LINE POLICE LINE
|
POLICE LINE POLICE LINE POLICE LINE
POLICE LINE POLICE LINE POLICE
|
POLICE LINE POLICE LINE POLICE LINE
POLICE
LINE POLICE LINE
|
|
Law
Enforcement
|
|
Zero Tolerance
|
|
The moment the light turns red, law enforcement can
ticket the driver.
Police assume that engineers time the traffic signals
correctly. Yet the police are not
aware that engineers ignore the needs of commercial vehicles. The police are not aware that
engineers do not consider physics and human factors correctly in the
yellow light formula. The police
are not aware that engineers use the wrong formula and plug the wrong
numbers into the formula.
The police are
aware of the three “E”s:
Engineering.
Education.
Enforcement. One cannot
have the latter without the former.
But police rely on engineers to tell them whether the engineering
is correct. Engineers do not
inform enforcement of their decision to make honest people run red
lights. Engineers do not confess
to the law enforcement that they do not know the physics of their own
formula. Engineers do not know how
to compute the tolerance in their yellow light calculations in order to
inform law enforcement of the leniency the law must grant the
driver. Engineers
will not incriminate themselves.
The police are trained to ticket drivers, not traffic
engineers.
Engineers are happy to perpetuate this training.
|
|
|
|
TxDOT
Report 0-4273-2, 2003, pp, 27-28.
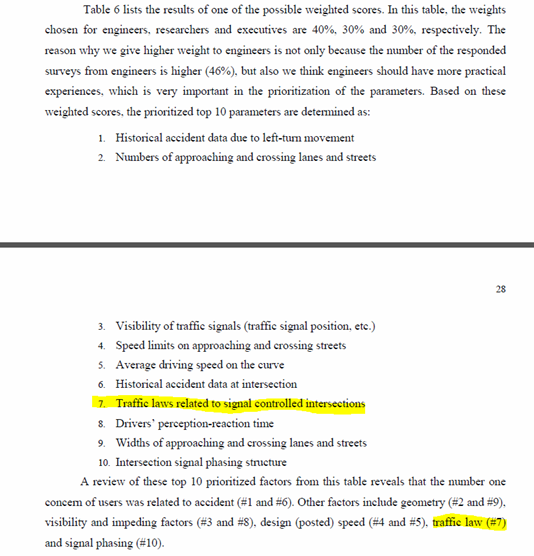
Texas’ report guides traffic engineers to set the
left turn yellow so that traffic can move most efficiently. The authors of the report poll
engineering professionals, asking them what parameters they consider most
important. The report lists those
parameters by priority.
It is crucial for law enforcement to understand that
engineers rank the legal motion of traffic as 7th
priority. It is crucial for law
enforcement to understand that the legal motion of traffic competes with
the engineers’ primary goal: efficient traffic flow. Engineers gladly sacrifice a driver’s
ability to traverse an intersection legally if it means a dozen cars can
make it through the intersection in a given signal cycle. It is standard practice for engineers
to knowingly make millions of drivers to run red lights in order to
attain level of service (LOS) goals.
An intersection with a low LOS makes the engineer look bad.
It is crucial for law enforcement to know that the
safety of traffic does not automatically imply the legal motion of
traffic and vice-versa.
The attitude
traffic engineers take when it comes to knowingly making drivers run red
lights is exemplified in these exerts from legal depositions of North
Carolina DOT’s traffic engineers (NCDOT):
|
|
|
|
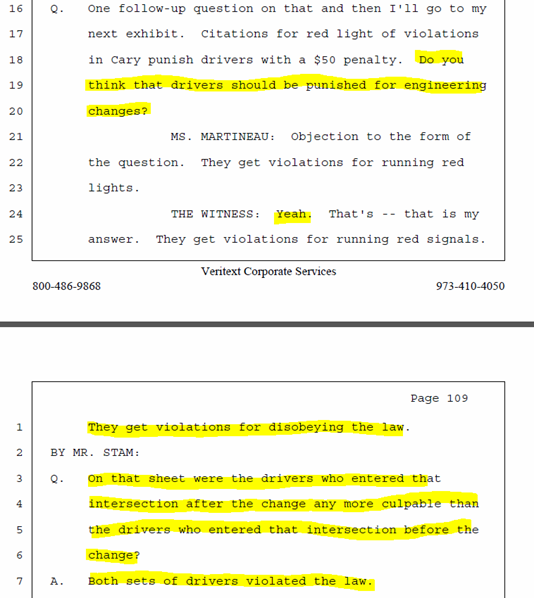
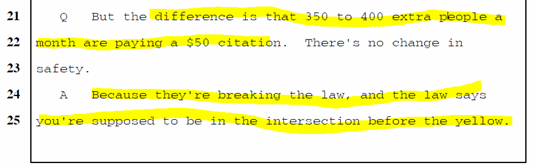
Deposition
of Dr. Joseph Hummer, pp. 108-109.
|
|
|
|
Deposition
of Lisa Moon, p 63. This is
Moon’s statement after shown a graph depicting a dramatic spike
in the red light running violations at NB Kildaire Farms Road at Cary
Parkway after the North Carolina DOT shortened its left turn yellow from
4 to 3 seconds.
|
|
|
|
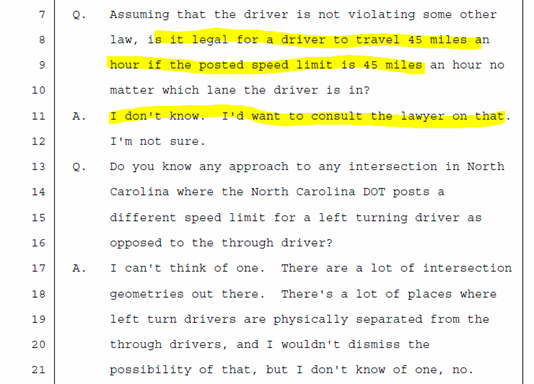
Deposition
of Dr. Joseph Hummer, pp. 63.
After Hummer works the algebra backwards and discovers that the
NCDOT expects all drivers approaching in the left turn lane to be
approaching at 23 mph or less, Hummer has to consult a lawyer to tell him
going 45 mph in a 45 mph speed zone is legal.
Law
enforcement assumes that traffic engineers set traffic signal timing
correctly. But traffic engineers
do not know what “correct” is.
They set traffic signal timing to “spec” but do not question the
spec. They do not understand the
spec and do not know if it actually properly handles physics:
|
|
|
|
Deposition
of Lisa Moon, p. 27.
|
|
|
|
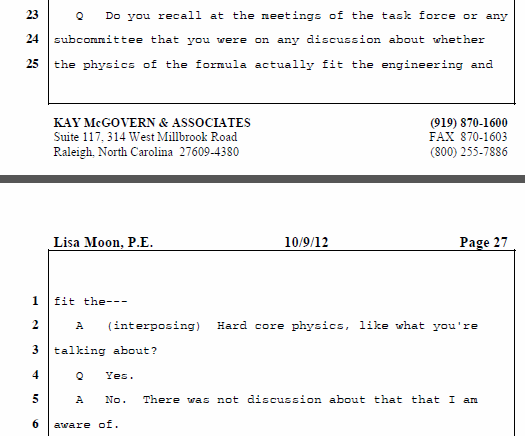
Deposition
of Lisa Moon, p. 22. Physics
is not the practice of engineers in the North Carolina DOT. But every State has a general
statute requiring professional engineers to know the mathematical and
physical sciences needed to do their jobs.
|
|
|
|
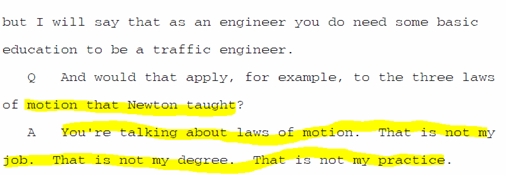
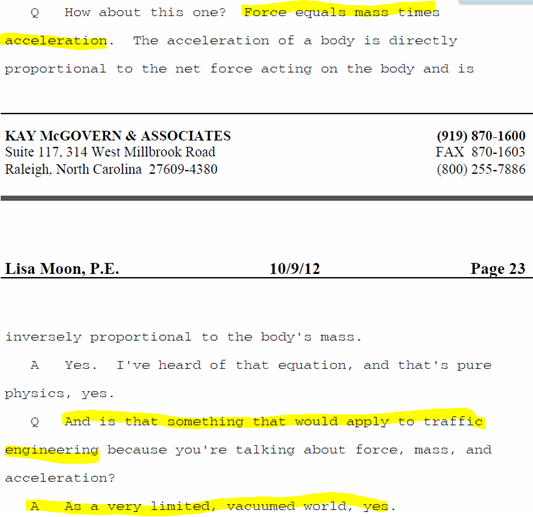
Deposition
of Lisa Moon, p. 22. Moon,
though an engineer in charge of the motion of traffic at 1000
intersections in North Carolina, could not name a single one of
Newton’s Laws of Motion. Paul
Stam, the attorney, had to help her out.
Moon believes that F = ma can only be used in a “very limited
vacuumed world.”
None of the professional engineers that the Town of
Cary used as expert witnesses could recite Newton’s Laws of Motion.
|
|
|
|
Deposition
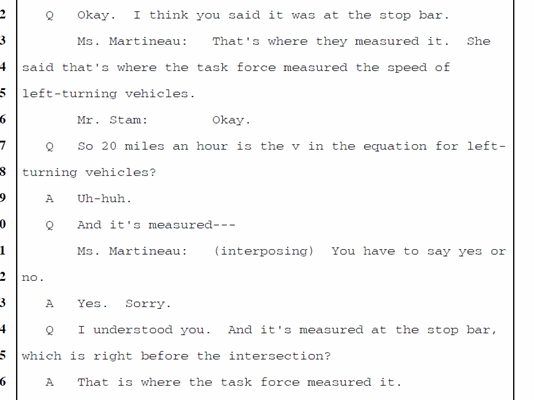
of Lisa Moon, p 37. The NCDOT
measures “v” at the stop bar as 20 mph for left-turning lanes, unaware
that the formula does not apply to left-turning lanes and unaware that v
is measured at the critical distance, not at the stop bar. On a 45 mph in North Carolina, the
critical distance is about 294 feet upstream from the intersection.
Many States, including California and Virginia, make
the same mistake for “v.”
|
|
|
|
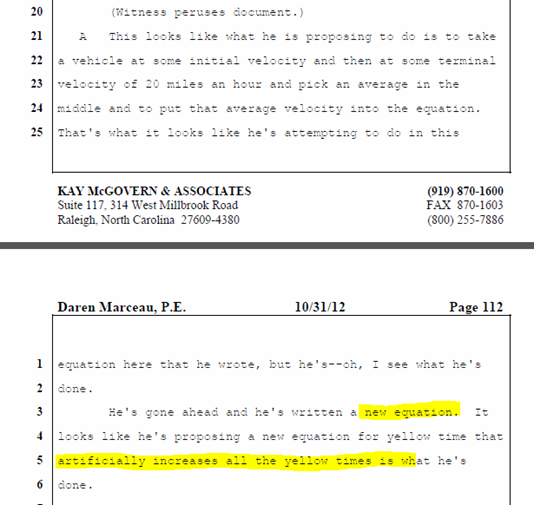
Deposition
of Daren Marceau, p. 112.
When shown the general equation for the yellow change interval,
Mr. Marceau did not recognize as such.
He though it was a new equation.
A page later, Marceau understood that the new equation would add
several seconds to the yellow.
Several seconds longer is what is required for turning movements
but Marceau dismissed the very equation from which his own formula is
derived.
|
|
|
2 to 4 Seconds
Tolerance
(In addition to using the correct formula.)
|
|
|
|
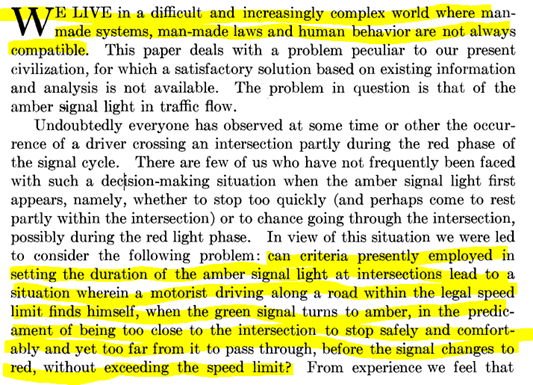
Gazis,
et al, The Problem with the Amber Signal Light in Traffic Flow, p.
112. These three physicists invented the
straight-through unimpeded yellow light formula traffic engineers use
today.
|
|
|
|
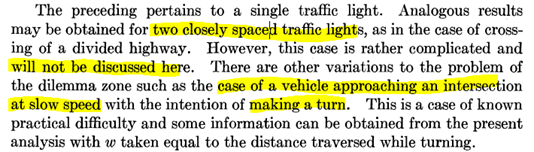
Gazis,
et al, The Problem with the Amber Signal Light in Traffic Flow, p. 129. The formula they invented does not apply
to two closely spaced traffic lights, nor turning, unless the turning is
done at a slow speed.
Today’s traffic engineers use the formula as a
one-size-fits-all.
|
|
"The formula actually violates the laws of physics
for certain types of motions, traffic motions," said Ceccarelli.
Ceccarelli said the Department of Transportation's
formula for yellow lights only works for cars going straight through the
light, and only cars that stay at or above the speed limit.
"It
doesn't apply to any type of traffic movement that has to decelerate into
the intersection," said Ceccarelli.
To check Ceccarelli's math, the I-Team went to the
source. Alexei Maradudin is now a physics professor at the University of
California - Irvine. In 1960, he came up with the root formula, which is
still used by the DOT.
"That's
correct. We did not, in our analysis consider turns; either left and
turns or right hand turns," said Maradudin. "It was really
straight through the intersection dynamics that we considered."
That formula made it into the traffic engineering
handbook, and has been used, or misused, as Ceccarelli puts it in North
Carolina, and across the country ever since.
"It
causes lots and lots of people to run red lights, involuntarily," he
said.
According to
Ceccarelli, yellow lights should generally be three to four seconds
longer. So, why are they set as they are? Based on a flawed formula
written 55 years ago?
"I
think that's a question that should be addressed to the Departments of
Transportation," said Maradudin.
|
|
ABC, WTVD, Channel 11 interview with Dr.
Maradudin and Mr. Ceccarelli., May 6, 2014
|
|
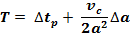
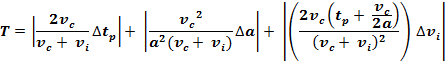
Error propagation.
The values for perception reaction time, deceleration rate, approach
speed and grade of road are not idyllic constants. The values have a range of equally
valid values or at least a standard deviation. Therefore the yellow change interval,
calculated from this imprecise values, is also imprecise. The measure of the yellow’s
impreciseness is calculated using error propagation.
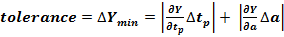 . . . . . .
Tolerance Required for Unimpeded Straight-Through
Movement Traffic:
Assume the error in vc
and G are negligible. The
tolerance, T, required for this type of traffic under these ideal
conditions is about 2.3 seconds.
Tolerance Required for Turning Traffic :
Assume the error in vc
and G are negligible. The
tolerance required for this type of traffic, using the turning formula,
under ideal conditions are 3.4 seconds.
|
|
Error propagation.
|
|
|
Yellow Duration for a Traffic Signal
Emergency Condition:
Car Unexpectedly Crossing Your Path
Contrast between Practice and What is Required
|
Driver or Vehicle Characteristic
|
ITE Yellow Light Specification
Practice
The ITE practice does not accommodate hazards occurring
in or nearby the intersection. ITE’s
yellow change interval requires a driver who can no longer stop comfortably,
to proceed at the speed limit or more without slowing down. Not only does the practice forbid
movements like turning, but also the practice compels the driver to
continue proceeding to the intersection at full speed without regard for
potential hazards. The driver may
see hazards, like cars turning left crossing his path in front of him, but
if he slows down for them, he risks certain hazard by running a red light.
|
Passenger Car
What is Required
|
Commercial Vehicles
What is Required
|
|
|

|
|
|
|
Perception
Reaction
Time
|
|
|
1.8 to 8.0
Seconds
|
|
|
|
AASHTO
Green Book 2011, page 2-41.
The more information content the driver has to deal with near or
at the intersection, the more complex the intersection.
|
|
|
|
Air Brake
Lag Time
|
|
|
|
|
Deceleration
|
|
10.0 ft/s2
|
|
|
|
ITE,
Traffic Engineering Handbook, 2010, p. 412. The ITE formula does not consider
emergencies occurring within or near the intersection.
This formula does not allow drivers to perform
“avoidance” maneuvers when approaching the intersection. Once the light turns yellow, the
driver must choose either stop or proceed at full speed v else he will
run a red light inadvertently.
The yellow time is not long enough for a driver to slow down to
avoid a hazard, or slow down for
any reason.
|
|
|
|
8.0 ft/s2
is Maximum a Truck can do on Wet Pavement
|
|
|
|
NCHRP
505, p. 48 0.25g = 0.25 * 32.2 ft/s2 = 8.0
ft/s2 Which is the best a truck driver can do on a
wet pavement in any situation.
|
|
|
Equation
|
|
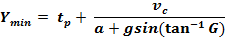
Straight-Through Unimpeded
Movement Equation
|
|
|
|
ITE,
Traffic Engineering Handbook, 2010, p. 412. The physics of this formula models only
straight-through traffic but ITE applies it to all traffic
movements.
The formula offers the driver a mutually exclusive
choice between stop and go full speed. If the driver must proceed because he
is too close to the intersection, the formula does not allow him to slow
down for any reason. The formula
does allow to slow down to turn, to slow down to avoid cars entering or
egressing from nearby business, to slow down to avoid a hazard, or to
slow down just to be cautious.
|
|

|
|
ITE,
Traffic Engineering Handbook, 2010, p. 412. The MUTCD caps the yellow change
interval to 5 seconds; but turning and/or avoidance movements can easily require
up to 10 seconds.
|
|
|
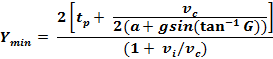
General Formula Only
|
|
General Formula That Works For all Non-Commercial
Traffic, including Avoidance Maneuvers
|
|
Stopping Distance (or critical distance) for all
Non-Commercial Traffic, Formula. vc is measured at distance c:
|
|
Derivation of Above Formulas from
Newton’s Second Law of Motion.
(G = grade, g =
earth’s gravitational acceleration = 32.2 ft/s2. See derivation).
The general formula allows drivers
to slow down on route to the intersection without running a red
light. The general formula
produces yellow times several
seconds longer than practice.
For example, the general formula for a typical 45 mph road
computes a yellow change interval about 3 seconds longer than the
straight-through formula.
|
|
|
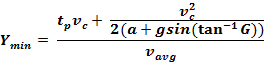
General Formula which includes Air
Brake Lag Time
|
|
General Formula That Works For all
Traffic, including Avoidance Maneuvers
|
|
Stopping Distance (or critical distance) Formula. vc is measured at distance c:
|
|
Derivation of Above Formulas from
Newton’s Second Law of Motion.
(G = grade, g =
earth’s gravitational acceleration = 32.2 ft/s2, tb
= air brake lag time. See
derivation).
The general formula allows drivers
to slow down on route to the intersection without running a red
light. The general formula
produces yellow times several
seconds longer than practice.
For example, the general formula for a typical 45 mph road
computes a yellow change interval about 5 seconds longer than the straight-through
formula.
|
|
|

